
Bengaluru and Shimla best cities in Ease of Living Index 2020 in India; Indore and NDMC leading municipalities: Ministry of Housing and Urban Affairs
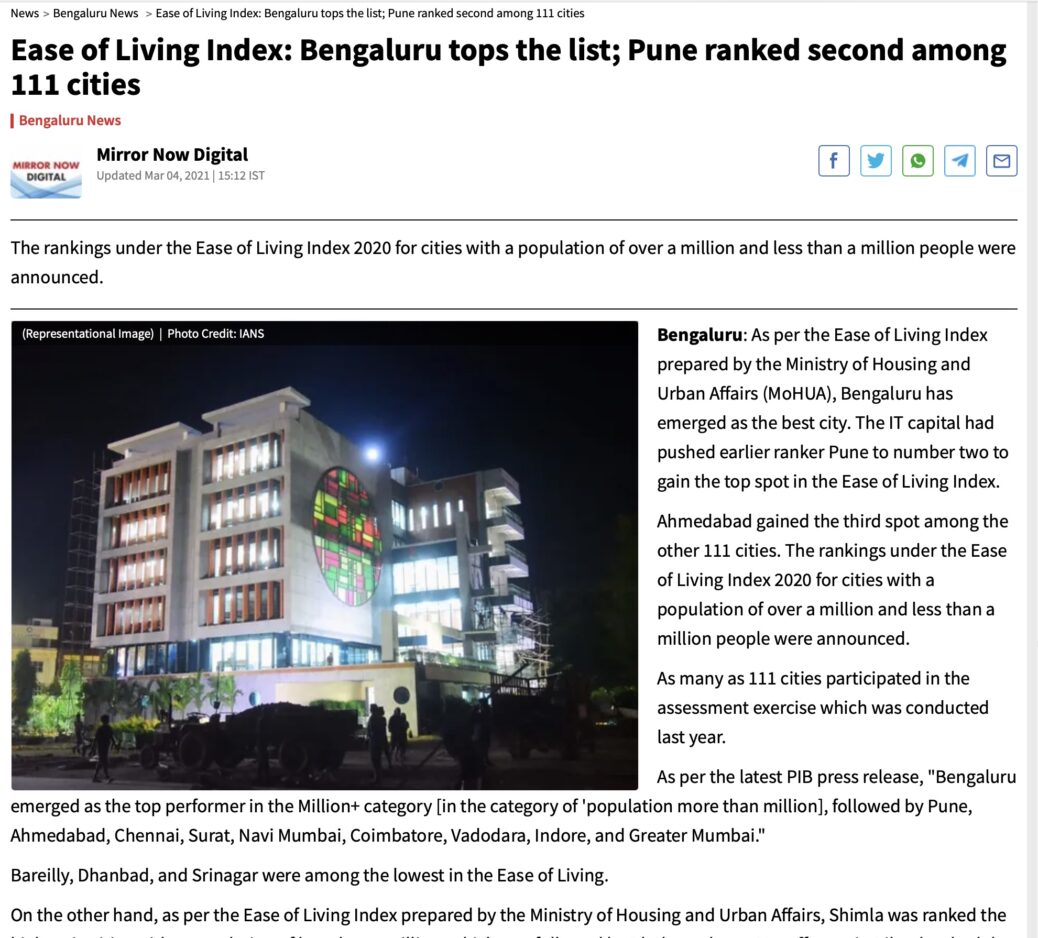
The Ministry of Housing and Urban Affairs released the final rankings of Ease of Living Index 2020 and the Municipal Performance Index 2020 today. The rankings were announced for cities with a population of more than a million, and cities with less than a million people. 111 cities participated in the assessment exercise that was conducted in year 2020.
The Ease of Living Index (EoLI) is an assessment tool that evaluates the quality of life and the impact of various initiatives for urban development. It provides a comprehensive understanding of participating cities across India based on quality of life, economic-ability of a city, and its sustainability and resilience. The assessment also incorporates the residents’ view on the services provided by city administration through a Citizen Perception Survey.
The Municipal Performance Index (MPI) was launched as an accompaniment to the Ease of Living Index. It seeks to examine local government practice in municipalities across areas of services, finance, policy, technology and governance. It seeks to simplify and evaluate the complexities in local governance practice and promote the ethos of transparency and accountability.
Both the indices represent an attempt to gauge the performance of cities across India on various parameters of urban living. The Ease of Living Index encapsulates the outcome indicators while the Municipal Performance Index captures the enabling input parameters. These indices provide a holistic assessment of cities based on their efforts to cultivate better quality of life, create infrastructure, and address challenges of urbanization.
Learnings gathered from these indices can help the government identify gaps, tap into potential opportunities, and increase efficiency in local governance to improve lives of citizens and fulfil broader development outcomes. The framework for these assessments were prepared by MoHUA with the Institute for Competitiveness as the knowledge partner.
The details of top ten ranked cities are at Annex. The rankings under both the indices can be viewed online at https://eol.smartcities.gov.in
The Ease of Living Index 2020 (EoLI)
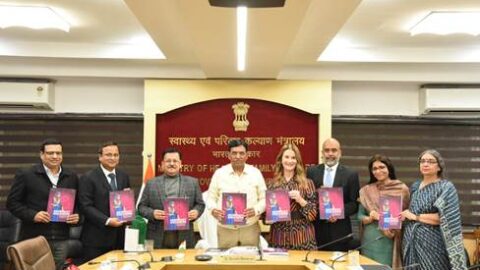
The release of rankings of Ease of Living Index 2020 and Municipal Performance Index 2020 was announced by Shri Hardeep Singh Puri, Minister of State (Independent Charge) Housing and Urban Affairs today at an online event.
The Ease of Living Index assessment builds on the learning from the previous edition in 2018 and strengthens the framework. The scope and parameters of the index were expanded based on the feedback received from key stakeholders and urban experts. A significant revision is in the form of separation of the outcome and input parameters that determine the ease of living of citizens. The latter has been incorporated as the Municipal Performance Index, which accompanies the Ease of Living Index 2020. Further, the weightages assigned to the pillars, the number of indicators, and the relevance given to Citizen Perception makes this framework very different from the earlier iteration. Due to these improvements to the index, it is pertinent to note that the scores of EoLI are not comparable with Ease of Living Index 2018.
The methodology and approach for the revised edition of EoLI and MPI were released by MoHUA in February 2019. Essentially, the EoLI report aims to measure the well-being of Indian citizens in 111 cities, across the pillars of Quality of Life, Economic-ability, and Sustainability, with 49 indicators under 13 categories. It also incorporates citizen perception of cities into the index through the Citizen Perception Survey that was conducted by the Ministry of Housing and Urban Affairs.
The EoLI primarily seeks to accelerate India’s urban development outcomes, including the achievement of the Sustainable Development Goals. The findings from the index can help guide evidence-based policymaking. It also promotes healthy competition among cities, encouraging them to learn from their peers and advance their development trajectory. Furthermore, the Citizen Perception Survey obtains views from citizens, allowing them to evaluate local service delivery and serve as a basis for dialogue.
The salient features of EoLI are as under.
- Participating cities had appointed nodal officers who were responsible for collecting and collating relevant data points from concerned departments. The data and relevant supporting documents were submitted online though a portal. There were several provisions available for assisting cities in the data collection procedures, with a central helpdesk (used by nodal officers) and over 50 assessors posted on ground to help nodal officers in all procedures.
- The EoLI 2020 strengthens its scope by consolidating the framework with the addition of a Citizen Perception Survey in the index, holding a weightage of 30%. It, therefore, examines the outcomes that lead to existing living conditions through pillars of Quality of Life, Economic Ability, Sustainability, spanning across 13 categories of -Education, Health, Housing and Shelter, WASH and SWM, Mobility, Safety and Security, Recreation, Level of Economic Development, Economic Opportunities, Environment, Green Spaces, and Buildings, Energy Consumption, and City Resilience, that account for 70% of the overall outcome.
- The Citizen Perception Survey (CPS) was undertaken to help validate citizens’ experience of their city in terms of service delivery. The assessment was conducted from 16th January 2020 till 20th March 2020. A total of 32.2 lakh citizens from 111 cities participated in the survey. Citizens gave their feedback through various channels vis. online feedback, scanning the QR code on printed advertisements, online submission on MyGovIndia.in, and face-to-face interaction with field personnel. Bhubaneshwar had the highest CPS score, followed by Silvassa, Davangere, Kakinada, Bilaspur and Bhagalpur.
- Since all cities encompass distinct development and progress levels, and population size, the cities were classified into different tiers based on their population size to allow fair comparison to occur. After a thorough investigation of all cities, the analysis covers 111 cities, categorising them into Million+ populated cities (those with a population of more than a million) and Less than Million populated cites (those with a population of less than a million) along with all the cities under the Smart Cities Program.
- In the Million+ category, Bengaluru emerged as the top performer, followed by Pune, Ahmedabad, Chennai, Surat, Navi Mumbai, Coimbatore, Vadodara, Indore, and Greater Mumbai in decreasing order.
- In the Less than Million category, Shimla was ranked the highest in ease of living, followed by Bhubaneshwar, Silvassa, Kakinada, Salem, Vellore, Gandhinagar, Gurugram, Davangere, and Tiruchirappalli in decreasing order.
The Municipal Performance Index 2020 (MPI)
Expanding the scope for the EoLI framework in order to make it more robust, a Municipal Performance Index assessment was also undertaken for the first time in the country. Whereas, the Ease of Living Index measures an outcome of the indicator, Municipal Performance Index focuses on the factors that produce those outcomes. The latter serves in determining elements that prevent efficient local governance in service delivery mechanisms, planning, financial systems, and governance practice.
The Municipal Performance Index is an effort to assess and analyse the performance of Indian municipalities based on their defined set of functions. The responsibilities of a municipality span across a range of verticals that include provision of basic pubic services to more complex domains like urban planning. The salient features of MPI are given below.
- The Municipal Performance Index provides a granular understanding of a municipalities’ functionalities and the extent of their development and capabilities. Through the index, citizens can better understand their local government administration, which in turn builds transparency and generates trust among key stakeholders.
- The MPI examined the sectoral performance of 111 municipalities (with Delhi being assessed separately for NDMC, and the three Municipal Corporations) across five verticals which comprise of 20 sectors and 100 indicators in all totality. The five verticals under MPI are Services, Finance, Policy, Technology and Governance.
- Services focus on the needs of every citizen’s growth such as clean water, city infrastructure and education to make the lives of citizens, seamless every day. Finance is the pillar which assesses a city’s growth in revenue and expenditure management. Technology helps makes cities smarter with the help of better governance facilities like improving digital literacy and digital access. Planning is essential for cities’ growth and better governance. Governance determines every city’s participation and success to making them smarter.
- The framework covers 20 varied sectors vis. Education, Health, Water & Wastewater, SWM & Sanitation, Registration & Permits, Infrastructure, Revenue Management, Expenditure Management, Fiscal Responsibility, Fiscal Decentralisation, Digital Governance, Digital Access, Digital Literacy, Plan Preparation, Plan Implementation, Plan Enforcement, Transparency & Accountability, Human Resource, Participation and Effectiveness.
- Similar to the EoLI index, the assessment framework has classified municipalities based on their population- Million+ (municipalities having over a million population) and Less than Million Population.
- In the Million+ category, Indore has emerged as the highest ranked municipality, followed by Surat and Bhopal. In the Less than Million category, New Delhi Municipal Council has emerged as the leader, followed by Tirupati and Gandhinagar.
Rankings
Top 10 Rankings for EoL for Million + Population
| Rank | City | Score |
| 1 | Bengaluru | 66.7 |
| 2 | Pune | 66.27 |
| 3 | Ahmedabad | 64.87 |
| 4 | Chennai | 62.61 |
| 5 | Surat | 61.73 |
| 6 | Navi Mumbai | 61.6 |
| 7 | Coimbatore | 59.72 |
| 8 | Vadodra | 59.24 |
| 9 | Indore | 58.58 |
| 10 | Greater Mumbai | 58.23 |
Top 10 Rankings for EoL for Population Less than Million
| Rank | City | Score |
| 1 | Shimla | 60.9 |
| 2 | Bhubaneswar | 59.85 |
| 3 | Silvassa | 58.43 |
| 4 | Kakinada | 56.84 |
| 5 | Salem | 56.4 |
| 6 | Vellore | 56.38 |
| 7 | Gandhinagar | 56.25 |
| 8 | Gurugram | 56 |
| 9 | Davanagere | 55.25 |
| 10 | Tiruchirappalli | 55.24 |
Top 10 Rankings for MPI for Million + Population
| Rank | City | Score |
| 1 | Indore | 66.08 |
| 2 | Surat | 60.82 |
| 3 | Bhopal | 59.04 |
| 4 | Pimpri Chinchwad | 59 |
| 5 | Pune | 58.79 |
| 6 | Ahmedabad | 57.6 |
| 7 | Rajpur | 54.98 |
| 8 | Greater Mumbai | 54.36 |
| 9 | Vishakhapatnam | 52.77 |
| 10 | Vadodra | 52.68 |
Top 10 Rankings for MPI for Population Less than Million
| Rank | City | Score |
| 1 | New Delhi MC | 52.92 |
| 2 | Tirupati | 51.69 |
| 3 | Gandhinagar | 51.59 |
| 4 | Karnal | 51.39 |
| 5 | Salem | 49.04 |
| 6 | Tiruppur | 48.92 |
| 7 | Bilaspur | 47.99 |
| 8 | Udaipur | 47.77 |
| 9 | Jhansi | 47.04 |
| 10 | Tirunelveli | 47.02 |


 announces the rankings for Ease of Living Index 2020 and the Municipal Performance Index 2020)