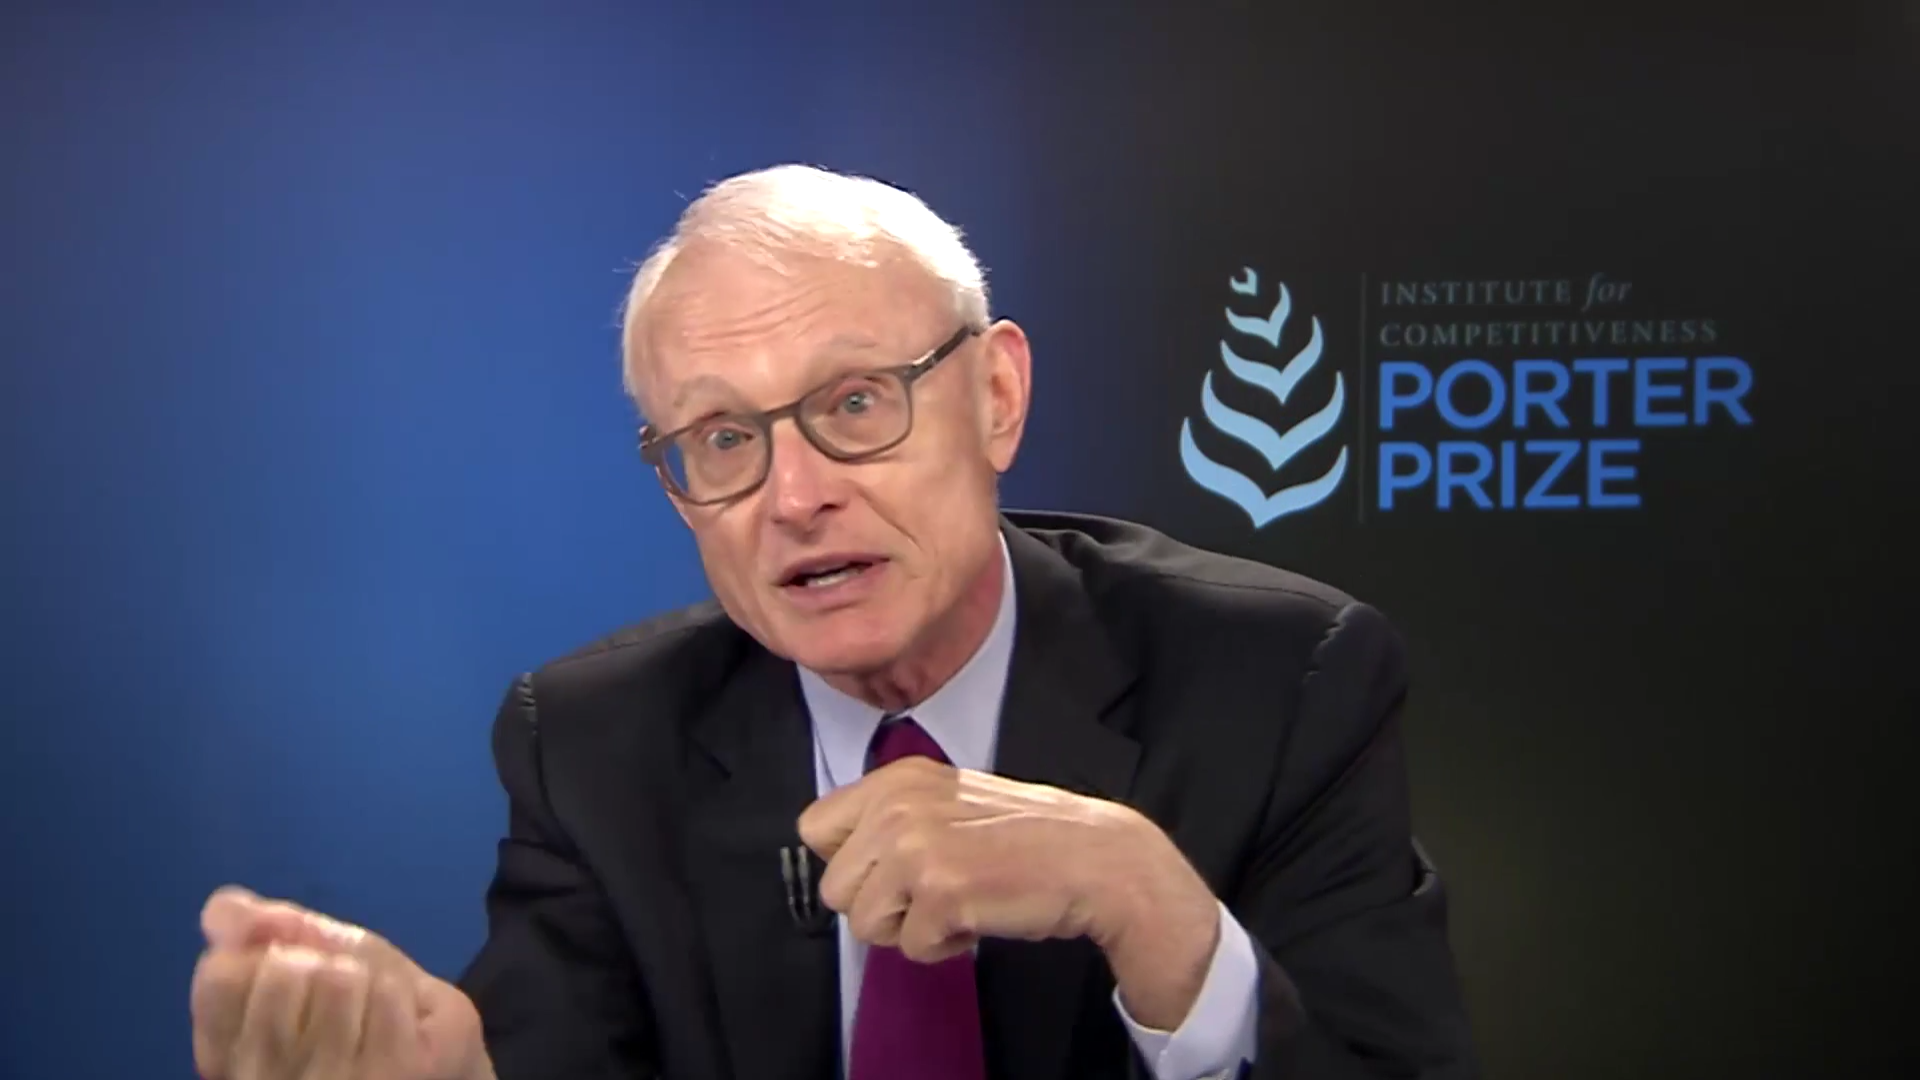
One of the fundamental questions in the realm of economics is – what drives prosperity? One may ask prosperity of ‘what’? The ‘what’ can be described as a region, which could be a locality/city, region/state, nation/country or an international free trade area, etc.? Framed differently, the question can also be put as why some (cities/regions/countries) become rich while others remain poor? The question appears to be quite broad and has fundamental implications for all the peoples of the world. This is because fundamental questions like these if properly answered can impact the lives of all the 7 billion inhabitants of the world. It is not just a theoretical academic question but has a bearing on economic growth, which is imperative for improving the quality of life of all peoples of the world.
The answer to the question is like the elephant story from the Indian subcontinent. According to a modern version of the story, blind men stumble upon the elephant, and each one of them comes to describe the elephant on the basis of what part of the elephant they come in contact with. They describe it thus as a wall, snake, spear, tree, and a fan. The blind men’s conception of the same reality is based on their individual perception of the reality. The ‘reasons for prosperity’ is one such question, which has had many scholars trying to conclusively find an answer to this seemingly simple and yet profound question.
Different researchers have attempted to respond to this question in various ways. Notably several views emerge. Mention first and foremost should be made of scholars like Angus Maddison whose construction of data with historical insight was instrumental in trying to answer this question. Maddison also sought to map the broad contours of the world economy from 1 AD to 2030 AD. With respect to research and different views, economists particularly Douglass North and most recently Daron Acemoglu and James Robinson have come to the conclusion that ‘institutions’ are instrumental in driving prosperity. They also put innovation at the center of the growth debate. According to them, economic growth can be explained by institutions that they describe as the ‘rules of the game’ in human interaction by which any society becomes prosperous. Another view is that of geographic location and factor endowments being equally important in explaining trade thus leading to economic prosperity. Notable proponents of this view include Jeffrey Sachs, Kenneth Sokoloff, and Stanley Engerman recently. Another view, which has gained prominence over the years, is the productivity-based view. This view focuses on human interaction in economic clusters, cities and knowledge spillovers as being fundamental in explaining economic growth. Proponents of this view include Porter (of the competitive advantage fame), Edward Glaeser (of the ‘city driving growth and prosperity’ fame) as well as Richard Florida (of the ‘Creative Class’ fame). Though there are a number of disagreements among these thinkers, their broad views remain consistent with the overall broad theme of growth and prosperity.
The ‘Creative Class’ as described by Richard Florida is a group of people, who are engaged in creative occupations. Also, these creative people involved in innovation are the main driving force for economic development according to Florida. Last year, the Institute for Competitiveness and Martin Prosperity Institute (where Richard Florida is professor and head) at the Rotman School of Management at the University of Toronto had tied up for research on ‘Creative Class’ in India. The Creative Economy of Indian States 2014 research and ranking was done recently. The report is based on the 3T framework that forms the basis of economic progress within the city/state/UT. These 3T’s are Tolerance, Talent and Technology that lead to economic prosperity. The broad level findings for the creativity index 2014 remain the same as last year with Delhi and Chandigarh retaining rank one and two respectively. Goa moves to spot three this year from previous years’ fifth position pushing down Kerala and Punjab. The maximum negative variation is found in states like Haryana and Karnataka with both of them moving down significantly on their performance on the aggregated creativity Index. States that have moved up in the ranking this year include Uttarakhand, Sikkim, and Himachal Pradesh. In the years, ahead India’s economic prosperity will be driven by states and union territories that do well to foster the creative class, which in turn will be instrumental in driving innovation and economic progress.
| Previous Years’ Data | Creativity Index of States 2013 | Creativity Index of States 2014 | Rank in 2013 | Rank in 2014 | Change in Ranks |
| Andaman & Nicobar Islands | 0.752 | 0.771 | 7 | 7 | 0 |
| Andhra Pradesh | 0.343 | 0.314 | 25 | 28 | -3 |
| Arunachal Pradesh | 0.343 | 0.400 | 25 | 23 | 2 |
| Assam | 0.371 | 0.333 | 24 | 26 | -2 |
| Bihar | 0.114 | 0.114 | 32 | 34 | -2 |
| Chandigarh | 0.914 | 0.905 | 2 | 2 | 0 |
| Chhattisgarh | 0.114 | 0.124 | 32 | 33 | -1 |
| Dadra & Nagar Haveli | 0.314 | 0.343 | 28 | 25 | 3 |
| Daman & Diu | 0.61 | 0.600 | 14 | 13 | 1 |
| Delhi | 0.943 | 0.943 | 1 | 1 | 0 |
| Goa | 0.819 | 0.829 | 5 | 3 | 2 |
| Gujarat | 0.419 | 0.324 | 22 | 27 | -5 |
| Haryana | 0.629 | 0.552 | 10 | 18 | -8 |
| Himachal Pradesh | 0.467 | 0.562 | 20 | 16 | 4 |
| Jammu & Kashmir | 0.448 | 0.438 | 21 | 22 | -1 |
| Jharkhand | 0.181 | 0.190 | 30 | 30 | 0 |
| Karnataka | 0.61 | 0.514 | 14 | 20 | -6 |
| Kerala | 0.857 | 0.781 | 4 | 5 | -1 |
| Lakshadweep | 0.514 | 0.581 | 18 | 15 | 3 |
| Madhya Pradesh | 0.114 | 0.133 | 32 | 32 | 0 |
| Maharashtra | 0.648 | 0.714 | 9 | 8 | 1 |
| Manipur | 0.619 | 0.590 | 12 | 14 | -2 |
| Meghalaya | 0.343 | 0.390 | 25 | 24 | 1 |
| Mizoram | 0.8 | 0.800 | 6 | 4 | 2 |
| Nagaland | 0.39 | 0.533 | 23 | 19 | 4 |
| Orissa | 0.095 | 0.095 | 35 | 35 | 0 |
| Pondicherry | 0.714 | 0.714 | 8 | 8 | 0 |
| Punjab | 0.867 | 0.781 | 3 | 5 | -2 |
| Rajasthan | 0.152 | 0.143 | 31 | 31 | 0 |
| Sikkim | 0.61 | 0.667 | 14 | 10 | 4 |
| Tamil Nadu | 0.514 | 0.562 | 18 | 16 | 2 |
| Tripura | 0.629 | 0.638 | 10 | 12 | -2 |
| Uttar Pradesh | 0.267 | 0.229 | 29 | 29 | 0 |
| Uttarakhand | 0.581 | 0.657 | 17 | 11 | 6 |
| West Bengal | 0.619 | 0.505 | 12 | 21 | -9 |
Published with Yahoo Finance on December 23, 2014.
