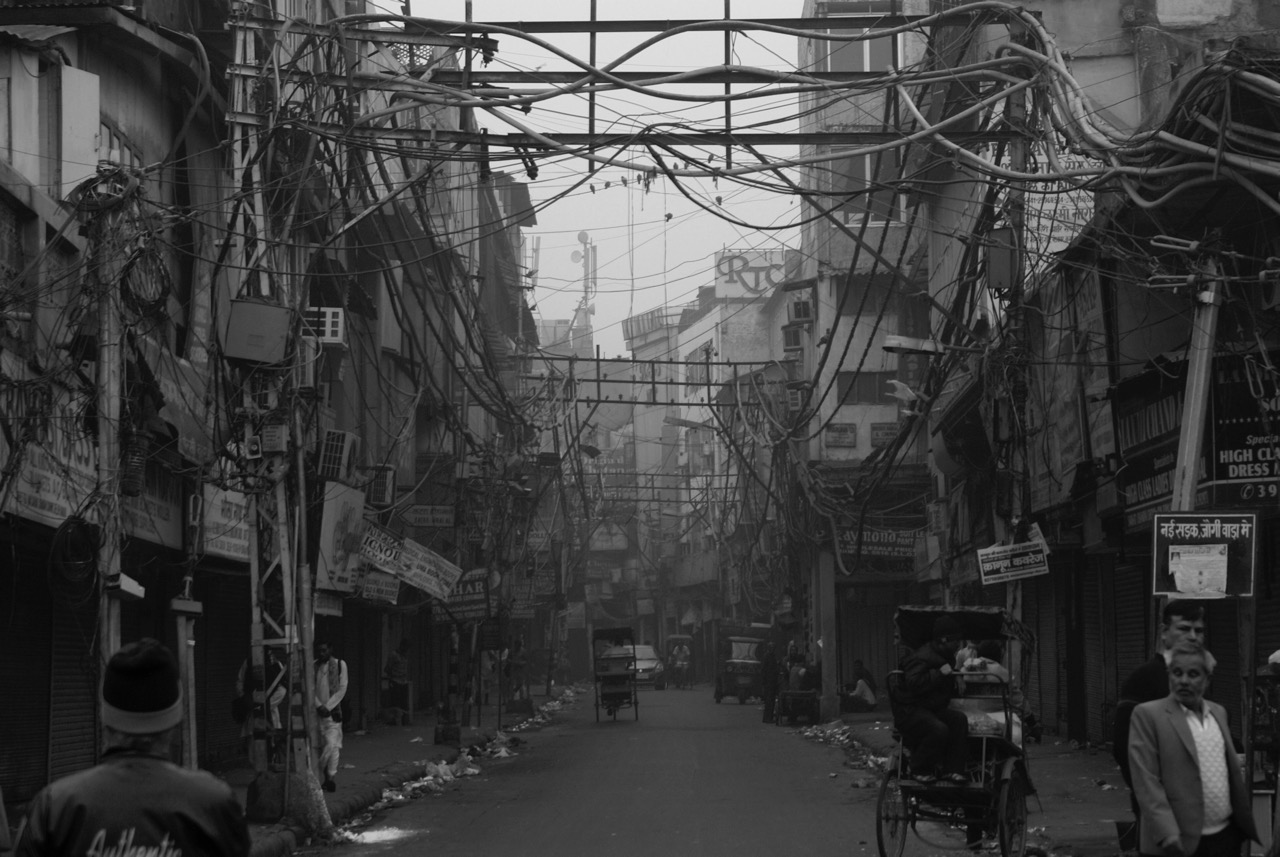
We live in a world of two pandemics- one caused by the virus and the other triggered by poverty. In the poverty pandemic, we are plagued by deprivations, instability and rising vulnerability that are not resilient to any life shocks. Here too, we’re met with the shrillness of depravity and death.
In 2018, The top 10%’s pre-tax income accounted for 57.1% in India, while the bottom 50 % held a 13.1% share. As per the World Inequality Report 2022, in the South and South-East Asian region, the bottom 50% has 5% of the wealth while the top 10% accounts for 67%. The same report highlights the widening gap between the top 1% and the bottom 50% in India as the former earns nearly 22% and a meagre 13.1% accumulation by the latter. This difference was much less in 2005, with the bottom 50% holding 16.5% and the top 1% at 19.7%. When the difference between the top 1% and bottom 99% is continuously reducing, it becomes vital to understand the distribution of incomes in order to highlight the glaring disparities and to trace the movement in and out of the poverty cycle. Income distribution also reveals to us the behaviour at the two ends of the income scale by looking closely at the patterns of consumption and expenditure. More than the concentration of wealth, income distribution signifies the extent and intensity of inequality as well as how resilient one can be to sudden economic shocks.
Today, an adult with an income of Rs 25,000 a month (Rs 3 00,000 per annum) has already become the part of top 10% of total salary incomes generated in 2019-20. According to the Periodic Labour Force Survey (PLFS) 2019-20, the top 1% has approximately ₹ 1,27,48,00,000 annual income, constituting 6.81% of total salary income. The top 10% add up to 33.58% (one-third of all incomes generated). The fact that a salary of twenty-five thousand rupees a month is in the top 10 % highlights not only the disparity but absolute dearth among the bottom 10%. The unit-level data of the survey has presented some individuals with zero or even negative incomes where there are no savings or expenditures exceed the earnings.
The growth rate of the top and the bottom incomes are also evident between the two surveys. The PLFS data released in 2017-18 shows the top 10% earning approximately ₹ 5,80,48,00,000 as compared to approximately ₹ 6,27,99,00,000 in 2019-20, marking a growth rate of 8.1%. In comparison, the bottom 10% registered a downfall of 0.94% in 2019-20 with a total earning of about ₹ 32,10,34,836 as compared to ₹ 32,41,09,824 in 2017-18. The bottom 50% registered a growth but at half the rate as the top 10% with a mere 3.75% of growth in 2019-20. Most Importantly, in both the surveys, it has been made clear that the top 10% earns more than the bottom 50%, with the difference between them only increasing. In both 2017-18 and 2019-20, the top 10% slab has earned at least twice of what the bottom 50% earns. In terms of workforce share, 20.8% of casual labourers earn less than ₹ 50,000 in a year ( less than ₹ 5,000 a month), while nearly 9% of regular-salaried employees earn less than ₹ 50,000 in a year (as per 2019-20 PLFS data).
The numbers have also emphasised that while some growth has taken place, it has been concentrated and marginalised the poor entirely. At the same time, it is crucial to understand that poverty reduction needs to target both income inequality as well as multi-dimensional poverty in the context of access to health, education, sanitation and assets. Even when we don’t have a simple way to represent all experiences of inequality and deprivation due to income disparity, we need to assess what these huge wage differences indicate at a macro level. In times when the affluent were able to amass massive wealth even during a pandemic, extreme poverty continues to be a pandemic that India hasn’t been able to fight against. Sustained redistributive efforts towards equitable distribution of incomes, setting minimum wages that can lead to savings, more employment opportunities and transferring benefits among the poorest of the poor are some ways that can create some mobility out of poverty.
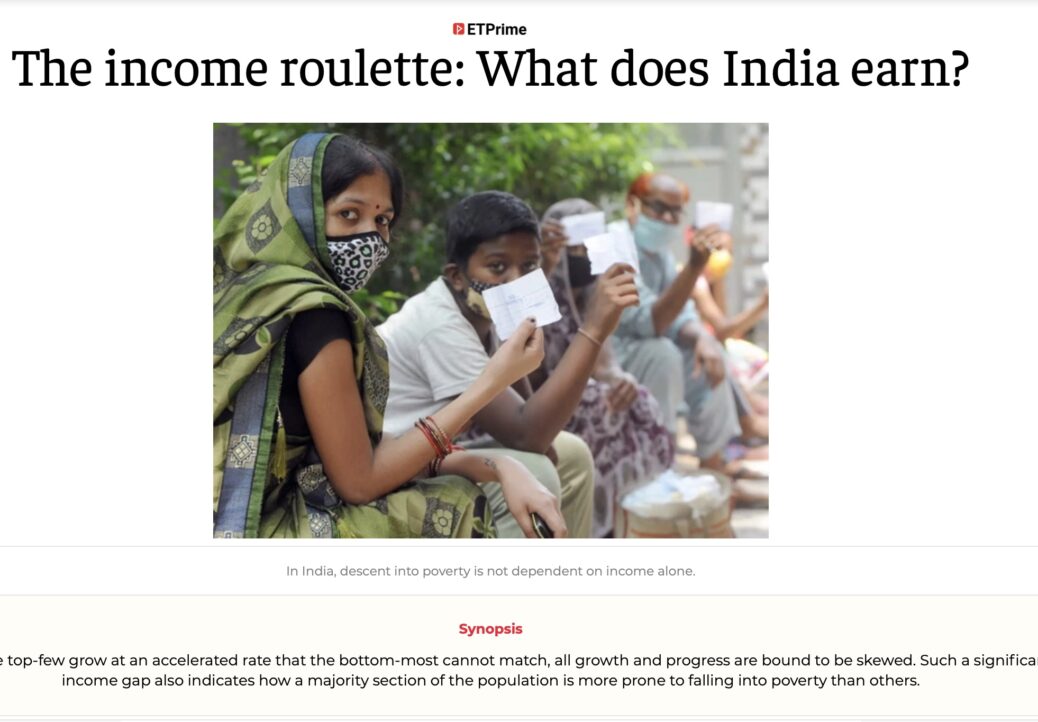
When the top-few grow at an accelerated rate that the bottom-most cannot match up to, all growth and progress are bound to be skewed. Such a significant income gap also indicates how a majority section of the population is more prone to falling into poverty than others. In India, descent into poverty is not dependent on income alone; major life events like death, wedding or even natural disasters have a huge impact on the mobility of an individual or household in and out of poverty. In these circumstances, a “steady” income is considered a cushion to at least protect from a sudden crash into the ground. In the case of India, that cushion has been deflated to the point where individuals have become excessively dependent on social protection schemes that can help in bare minimum sustenance if not for triggering upward mobility.
The article was published with Economic Times on March 2, 2022
