India and its Income Inequality
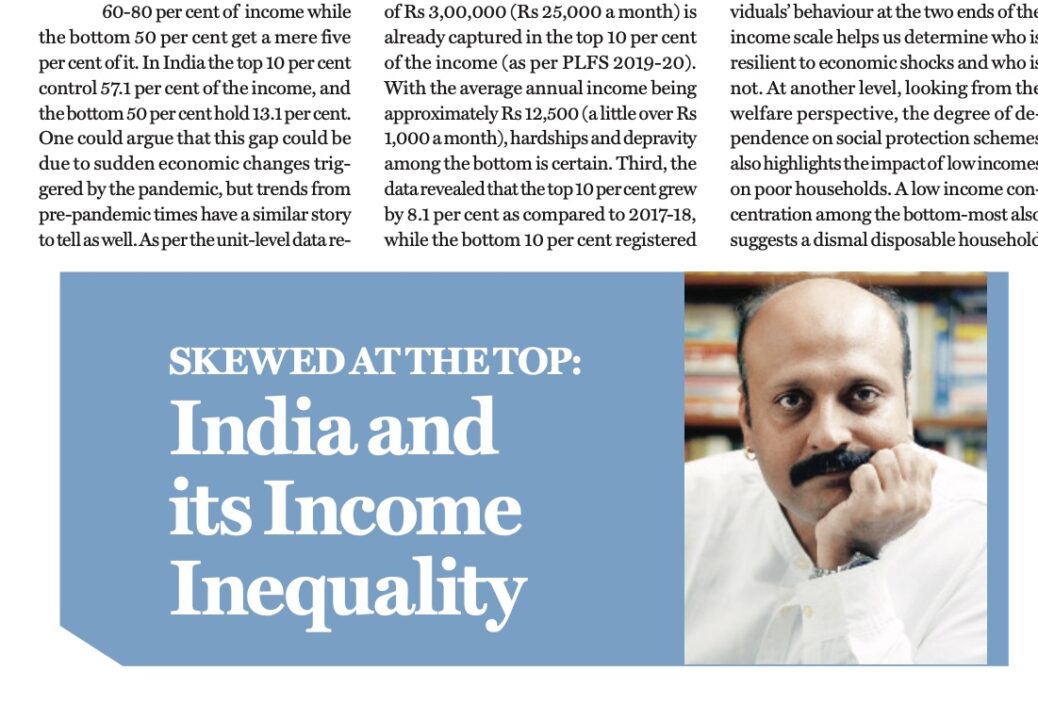
In the last two years of the pandemic, the world has been a witness to the play of the rich getting richer and at the cost of the poor. In the World Inequality Report 2022, it has been revealed that globally, the wealthiest 10% capture 60-80% of income while the bottom 50% gets a mere 5%. In India the top 10% controls 57.1% of the income, and the bottom 50% holds 13.1%. One could argue that this gap could be due to sudden economic changes triggered by the pandemic, however, trends from pre-pandemic times have a similar story to tell. As per the unit-level data released by the Periodic Labour Force Survey (PLFS) in 2017-18, the top 10% of salaried incomes held 32.5% of the total incomes generated in that year. By 2019-20, this number rose to 33.58%. In both surveys, the top 10% continues to earn twice as much as the bottom 50%.
The concentration of income at the top has significant implications for understanding inequality and poverty in the country. First, as the gap between the top-few and the bottom-most widens, wealth inequality gets intensely profound. Globally, the bottom 5% barely holds any wealth (according to the World Inequality Report 2022), with India and Latin America poorly faring among other regions. In India, the PLFS 2019-20 data has presented zero and even negative annual incomes meaning that there are individuals with no savings or where expenditure exceeds the income with a possibility of debt. Second, the yearly income of 3,00,000 Rupees (25,000 Rupees a month) is already captured in the top 10% of the income (as per PLFS 2019-20). With the average annual income being approximately 12,500 Rs (a little over 1,000 Rs a month), hardships and depravity among the bottom is certain. Third, the data revealed that the top 10% grew by 8.1% as compared to 2017-18, while the bottom 10% registered a downfall by 0.94%. Whereas the bottom 50% accounted for some growth – 3.75%, it is clear that the growth rate is slow-paced and has marginalised the poorest of the poor. In terms of workforce share, 20.8% of casual labourers earn less than ₹ 50,000 in a year (less than ₹ 5,000 a month), while nearly 9% of regular-salaried employees earn less than ₹ 50,000 in a year (as per 2019-20 PLFS data).
There is no easy way to account for individual experiences of depravity, and the government surveys have their own set of limitations, but what these numbers tell us at a macro-level is the extent and intensity of poverty and inequality. Income is a marker that influences the consumption, expenditure, and savings patterns of a household. Assessing individuals’ behaviour at the two ends of the income scale helps us determine who is resilient to economic shocks and who is not. At another level, looking from the welfare perspective, the degree of dependence on social protection schemes also highlights the impact of low incomes on poor households. A low income concentration among the bottom-most also suggests a dismal disposable household income which further impedes their access to proper healthcare, education and resources required for sustenance leading to stagnated economic mobility. Low incomes or loss of income is also a reason for households descending into multi-dimensional poverty. In this scenario, redistributive measures like the transfer of benefits and proactively increasing income and employment for the bottom-most are ways to enhance the financial and existential security of poor households.
The article was published with Business world
