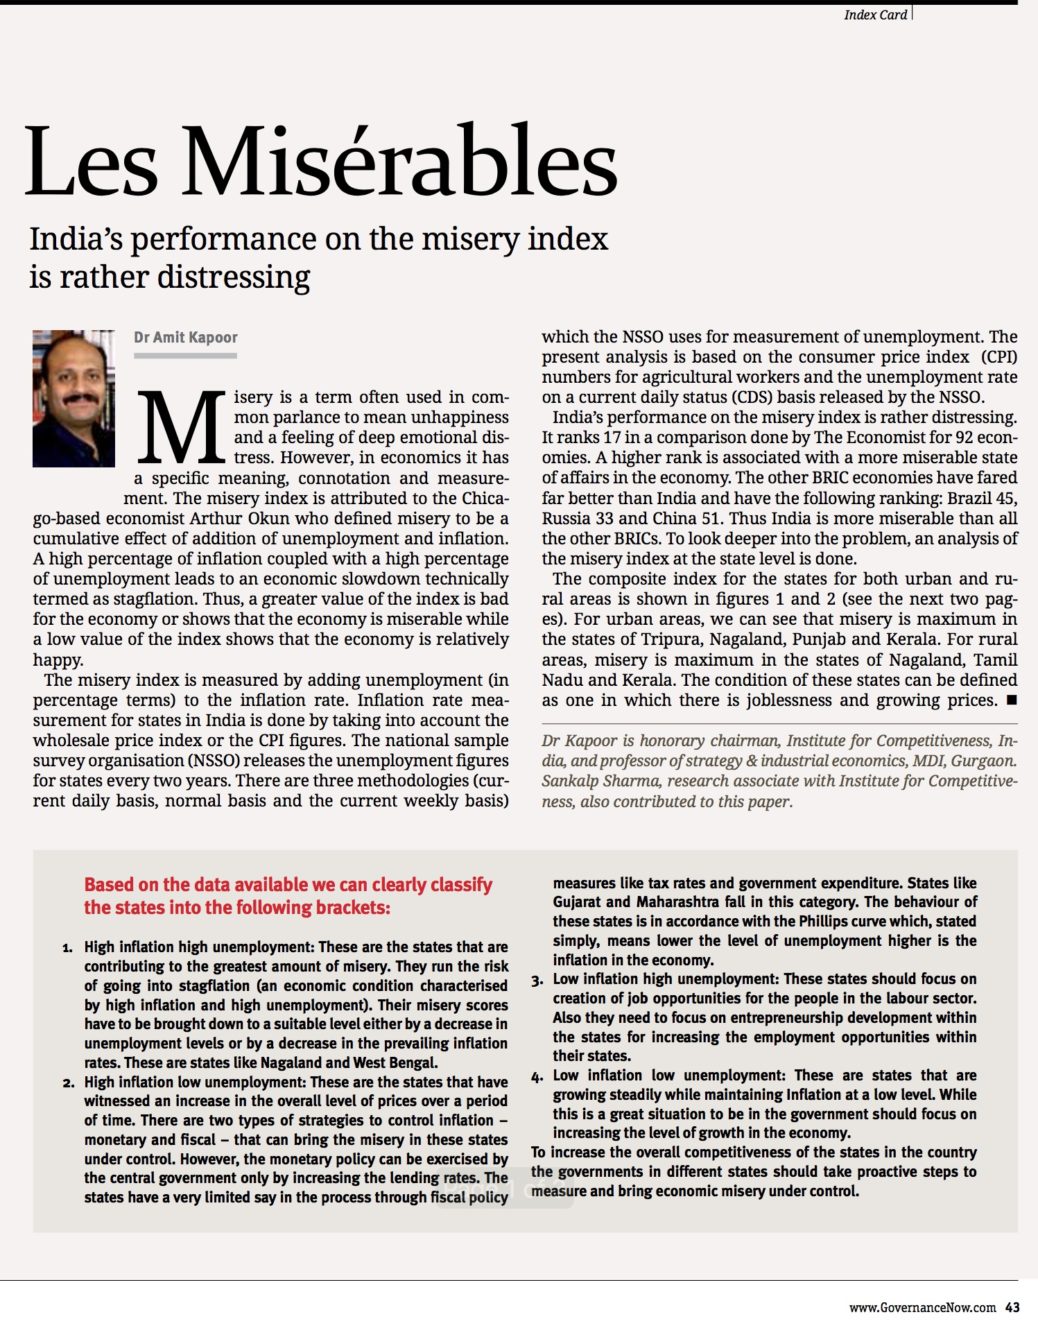
Misery is a term often used in common parlance to mean unhappiness and a feeling of deep emotional distress. However, in economics it has a specific meaning, connotation and measurement. The misery Index is attributed to the Chicago economist Arthur Okun who defined misery to be a cumulative effect of addition of unemployment and Inflation. A high percentage of Inflation coupled with a high percentage of unemployment leads to an economic slowdown technically termed as a condition called stagflation. Thus, a greater value of the Index is bad for the economy or shows that the economy is miserable while a low value of the index shows that the economy is relatively happy.
Misery index is measured by adding unemployment (in percentage terms) to the Inflation rate. Inflation rate measurement for states in India is done by taking into account the WPI figures or the CPI figures. The National Sample Organization (NSSO) releases the unemployment figures for states every two years. There are three methodologies (Current daily basis, Normal basis and the current weekly basis), which the NSSO uses for measurement of Unemployment. The present analysis is based on the CPI Consumer price Index numbers for Agricultural workers and the unemployment rate on a current daily status (cds) basis released by the NSSO.
India’s Performance on the Misery Index is rather distressing. It ranks 17 in a comparison done by The Economist for 92 economies. A higher rank is associated with a more miserable state of affairs in the economy. The other BRIC economies have fared far better than India and have the following ranking Brazil: 45, Russia: 33, and China: 51. Thus India is miserable than all the other BRIC’s. To look deeper into the problem an analysis of the Misery Index at the state level is done.
The composite Index for the states for both Urban and Rural areas is shown in figure 1 and 2. For urban areas we can see that misery is maximum in the states of Tripura, Nagaland, Punjab, and Kerala. For rural areas the misery is maximum in the states of Nagaland, Tamil Nadu and Kerala. The condition of these states can be defined, as one in which there is joblessness and growing prices.
Based on the data available we can clearly classify the states into the following brackets:
- High Inflation High Unemployment: These are the states that are contributing to the greatest amount of misery. They run the risk of going into stagflation (an economic condition characterized by high Inflation and high unemployment). Their Misery scores have to be brought down to a suitable level either by a decrease in unemployment levels or by decreasing the prevailing inflation rates. These are states like Nagaland and West Bengal.
- High Inflation Low Unemployment: These are the states that have witnessed an increase in the overall level of prices over a period of time. There are two types of strategies – Monetary and Fiscal that can bring the misery in these states under control. However the monetary policy can be exercised by the central government only by increasing the lending rates. The states have a very limited say in the process through fiscal policy measures like tax rates and government expenditure. States like Gujarat and Maharashtra fall in this category. The behavior of these states is in accordance with the Phillips curve which stated simply means lower the level of unemployment higher is the inflation in the economy.
- Low Inflation High Unemployment: These states should focus on creation of job opportunities for the people in the labour sector. Also they need to focus on entrepreneurship development within the states for increasing the employment opportunities within their states.
- Low Inflation Low Unemployment: These are states that are growing steadily while maintaining Inflation at a low level. While this is a great situation to be in the government should focus on increasing the level of growth in the economy.
To increase the overall competitiveness of the states in the country the governments in different states should take proactive measures to measure and bring economic misery under control.
The article was published with Governance Now in the issue April 1-15, 2012. Download PDF
